

Reports & Analysis
Great Again: The Trump Boom vs. The Bidenomics Bust

The Challenge
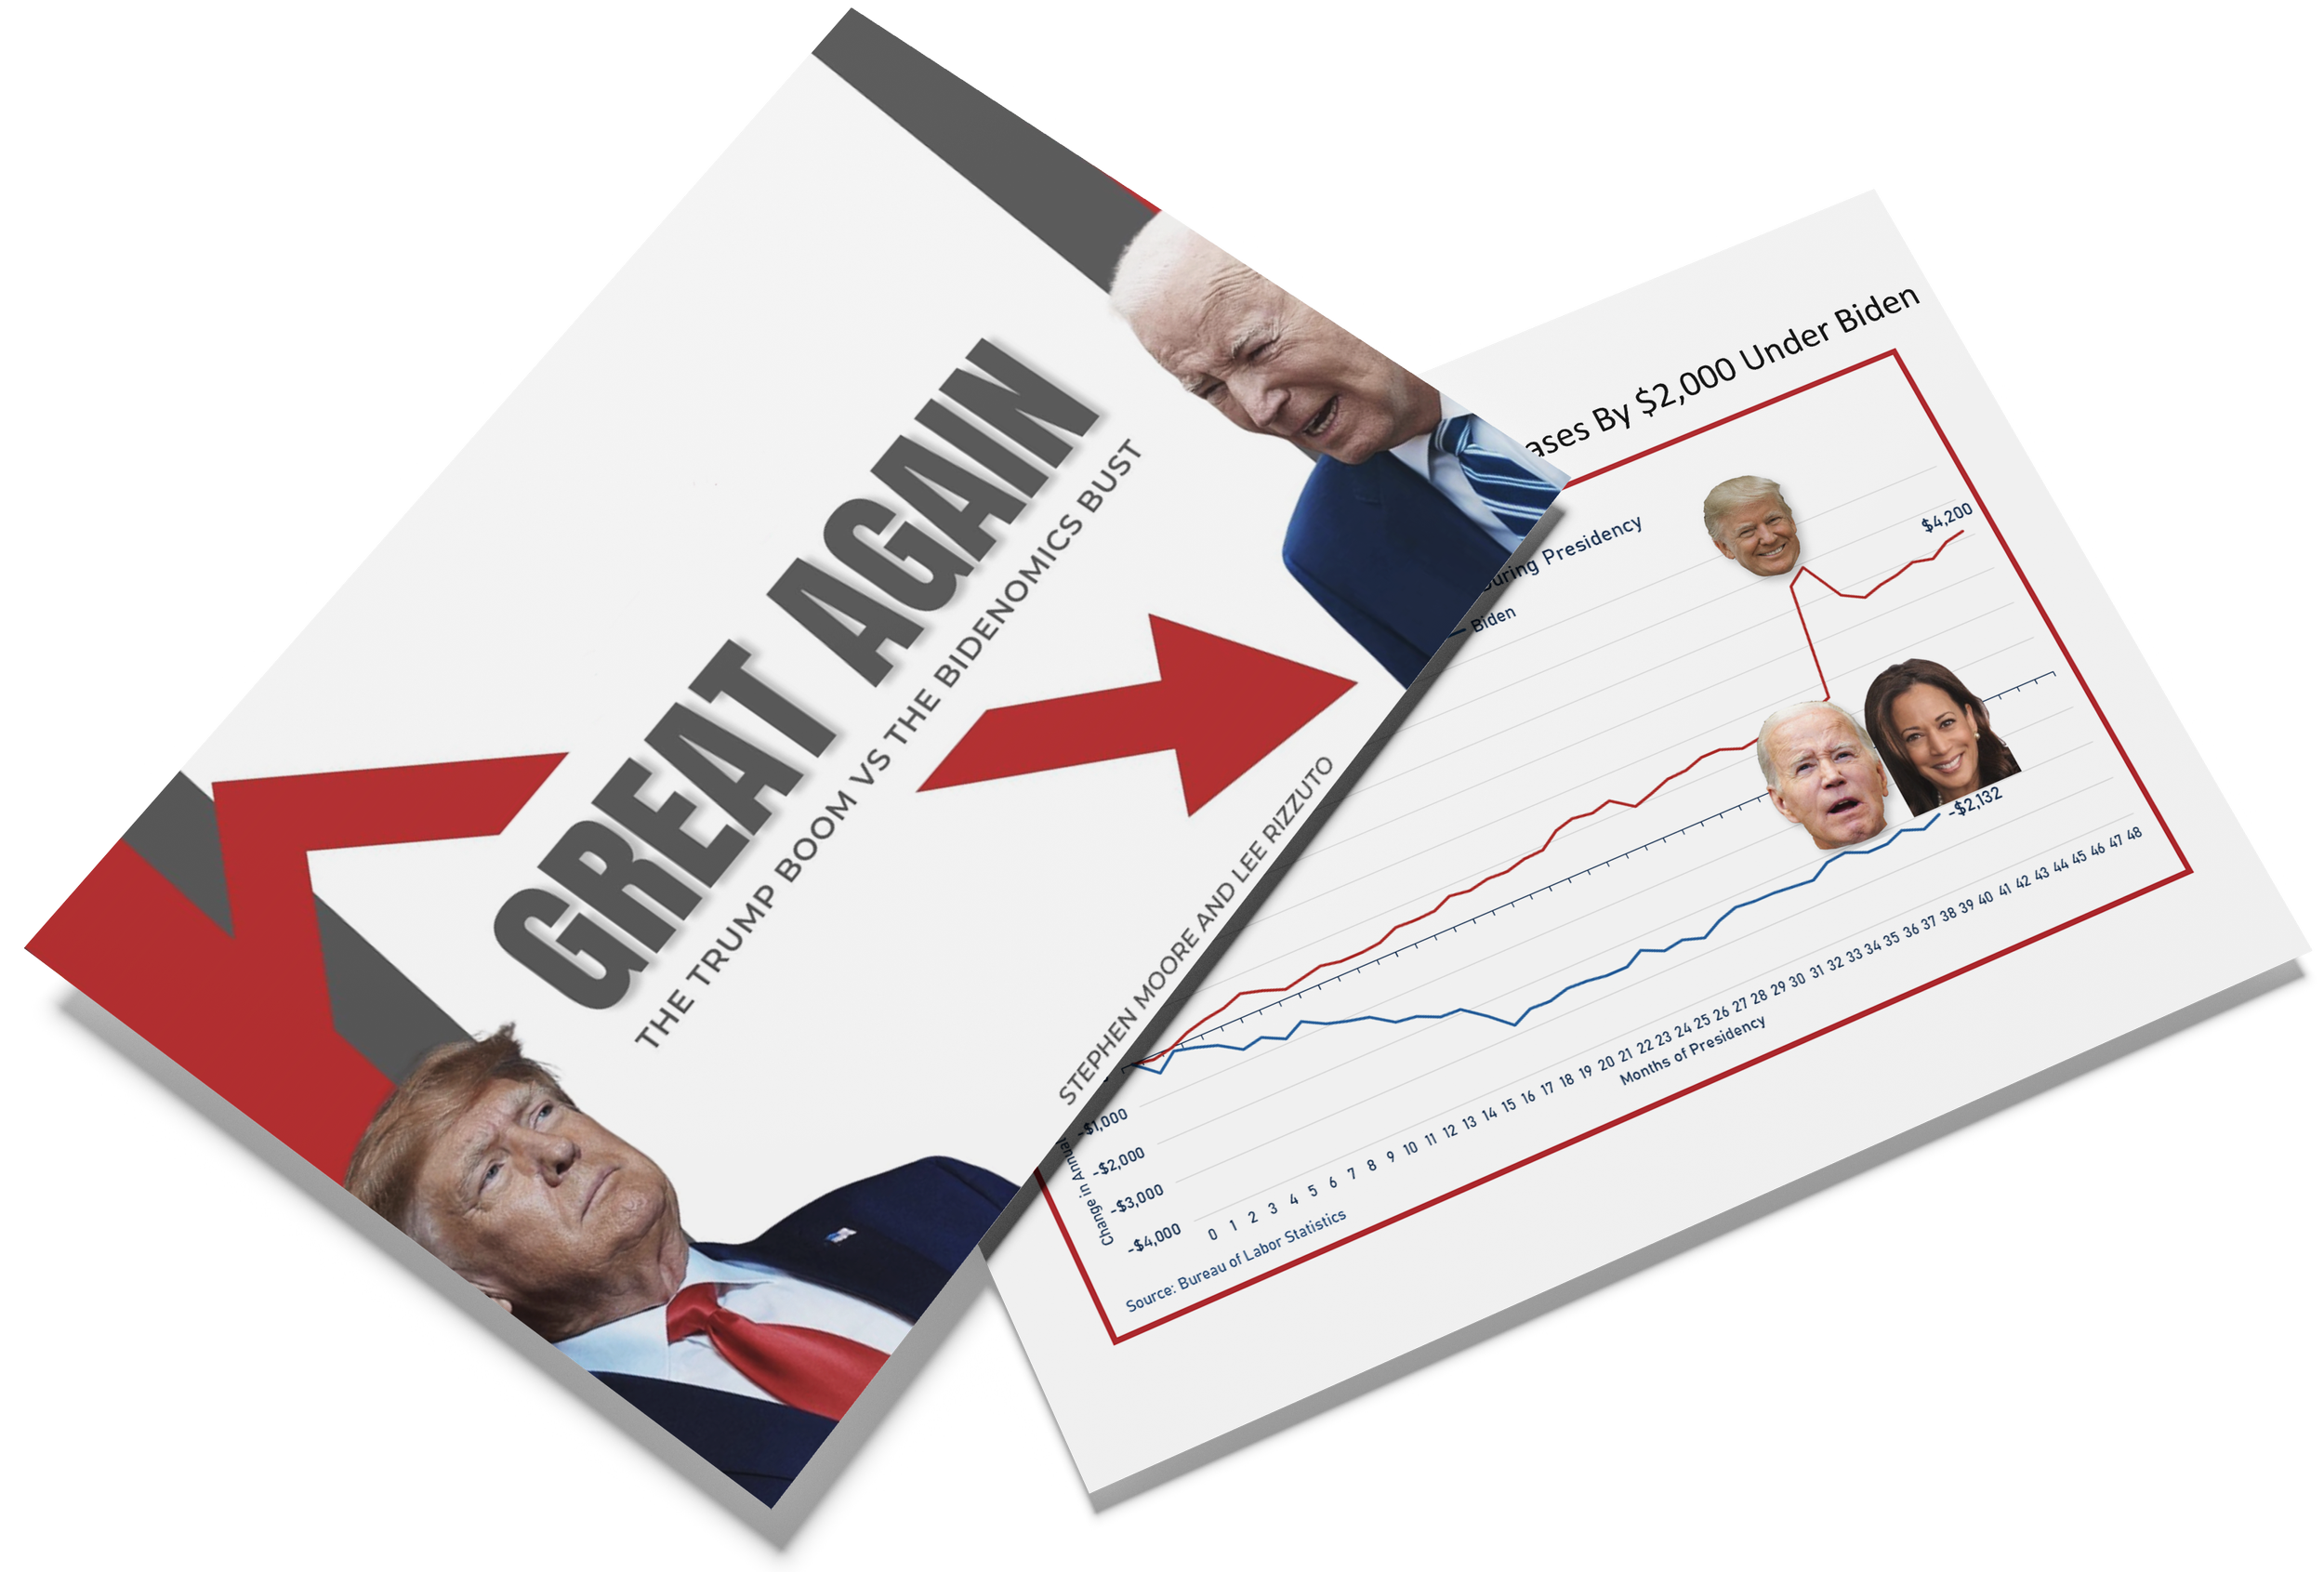
A side-by-side economic comparison argues that the Trump years delivered stronger income growth, lower inflation, and better market returns than the Biden years — and that the difference isn't marginal, it's measured in trillions of dollars in debt, thousands of dollars in household costs, and double-digit swings in consumer confidence.
What the Evidence Shows
Across income, prices, borrowing costs, and markets, the data shows a consistent gap between the two administrations' economic track records.
$7,900
Gap in real median household income growth between the Trump and Biden years, per Census Bureau data — the difference between a income gain under Trump and an income loss under Biden.
3x
How much higher annual inflation ran under Biden compared to Trump, based on Bureau of Labor Statistics CPI data (5.3% average vs. 1.9%).
$7.2T
Additional federal debt added under Biden relative to pre-2021 CBO projections.

The Real Question
Not whether either administration inherited a perfect economy — but whether the policy choices each made (on taxes, energy, spending, and regulation) explain the diverging results, or whether outside forces like the pandemic recovery do the heavier lifting.
Bottom Line
The report argues the numbers tell a consistent story: higher take-home pay, lower prices, and stronger markets under Trump, against rising debt, borrowing costs, and living expenses under Biden.
U.S. Census Bureau, "Income in the United States"; U.S. Bureau of Labor Statistics, CPI data; Congressional Budget Office, January 2021 and June 2024 forecasts.